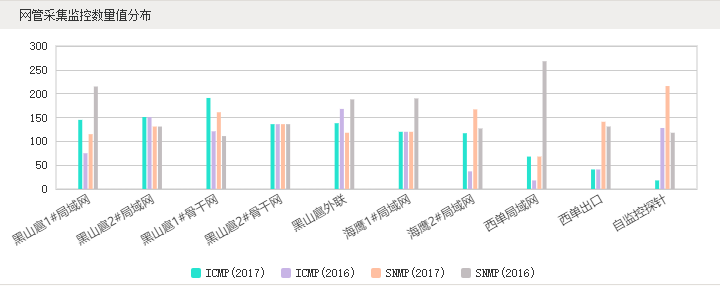
echarts自定义toolbox来更改指定数据
- 参数分别是echars数据、事件方法
1
2
3
4
5
6
7
8
9
10
11
12
13
14
15
16
17
18
19
20
21
22
23
24
25
26
27
28
29
30
31
32
var loadDrugs = function(){
echart_.setOption({
grid: [{
left: 50,
right: 50,
top: '60%',
height: '35%'
}, {
left: 50,
right: 50,
top: '18%',
height: '35%'
}],
})
}
toolbox: {
feature: {
dataZoom: {
yAxisIndex: 'none'
},
restore: {},
saveAsImage: {},
myTool2: {
show: true,
title: '自定义按钮功能',
icon: 'image://http://echarts.baidu.com/images/favicon.png',
onclick: function (a,b,c){
loadDrugs()
}
}
}
},1
2
3
4
5
6
7
8
9
10
11
12
13myTool2: {
show: true,
title: '自定义按钮功能',
icon: 'image://http://echarts.baidu.com/images/favicon.png',
onclick: function (a,b,c){
option.title ={
text: 'aaaa',
x: 'center'
},
echart_.setOption(option);
}
}


